In this post…
The next time you log in to your Intervals account you’ll notice the new Dashboard tab at the top of the screen. After brainstorming and researching several new feature ideas with our customers, we kept circling back to the same basic need. Customers want visual tools that can give them answers quickly and accurately.
The visual project dashboard is a fresh start in this new direction, and the first of several visual tools we’ll be adding to help our customers better manage and track their projects, tasks, and time.
Think of the visual project dashboard like a report. But, instead of simply churning out numbers, the visual project dashboard organizes and interprets your data using meaningful graphs, and answers two important questions…
How healthy are my projects?
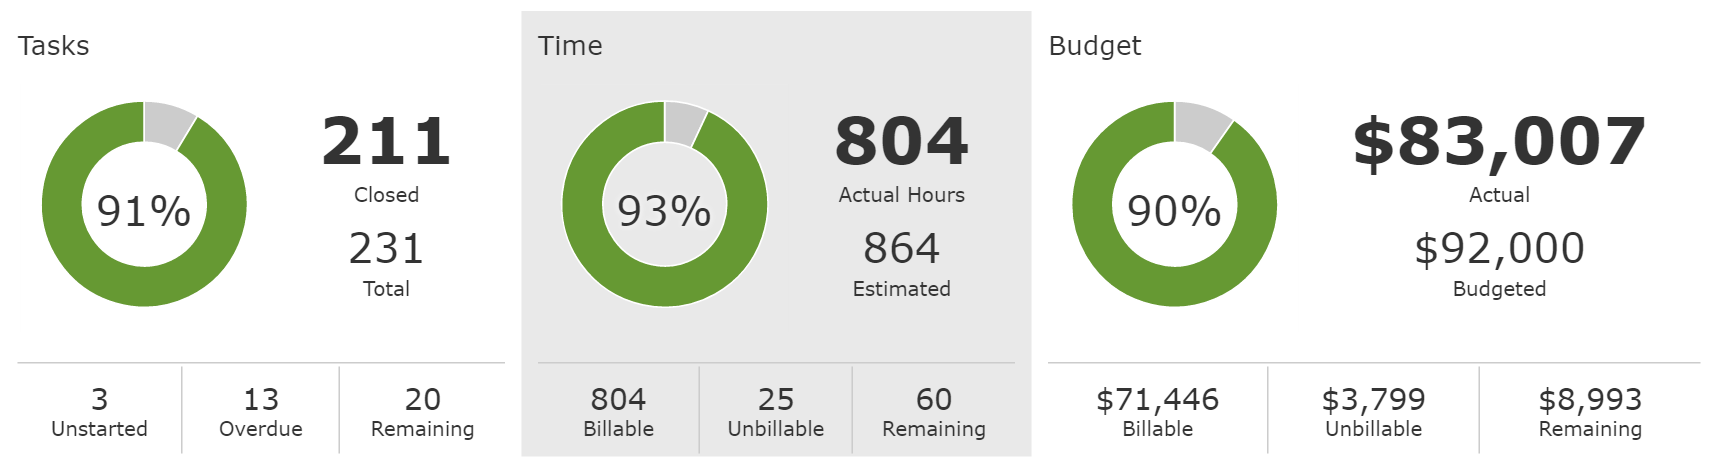
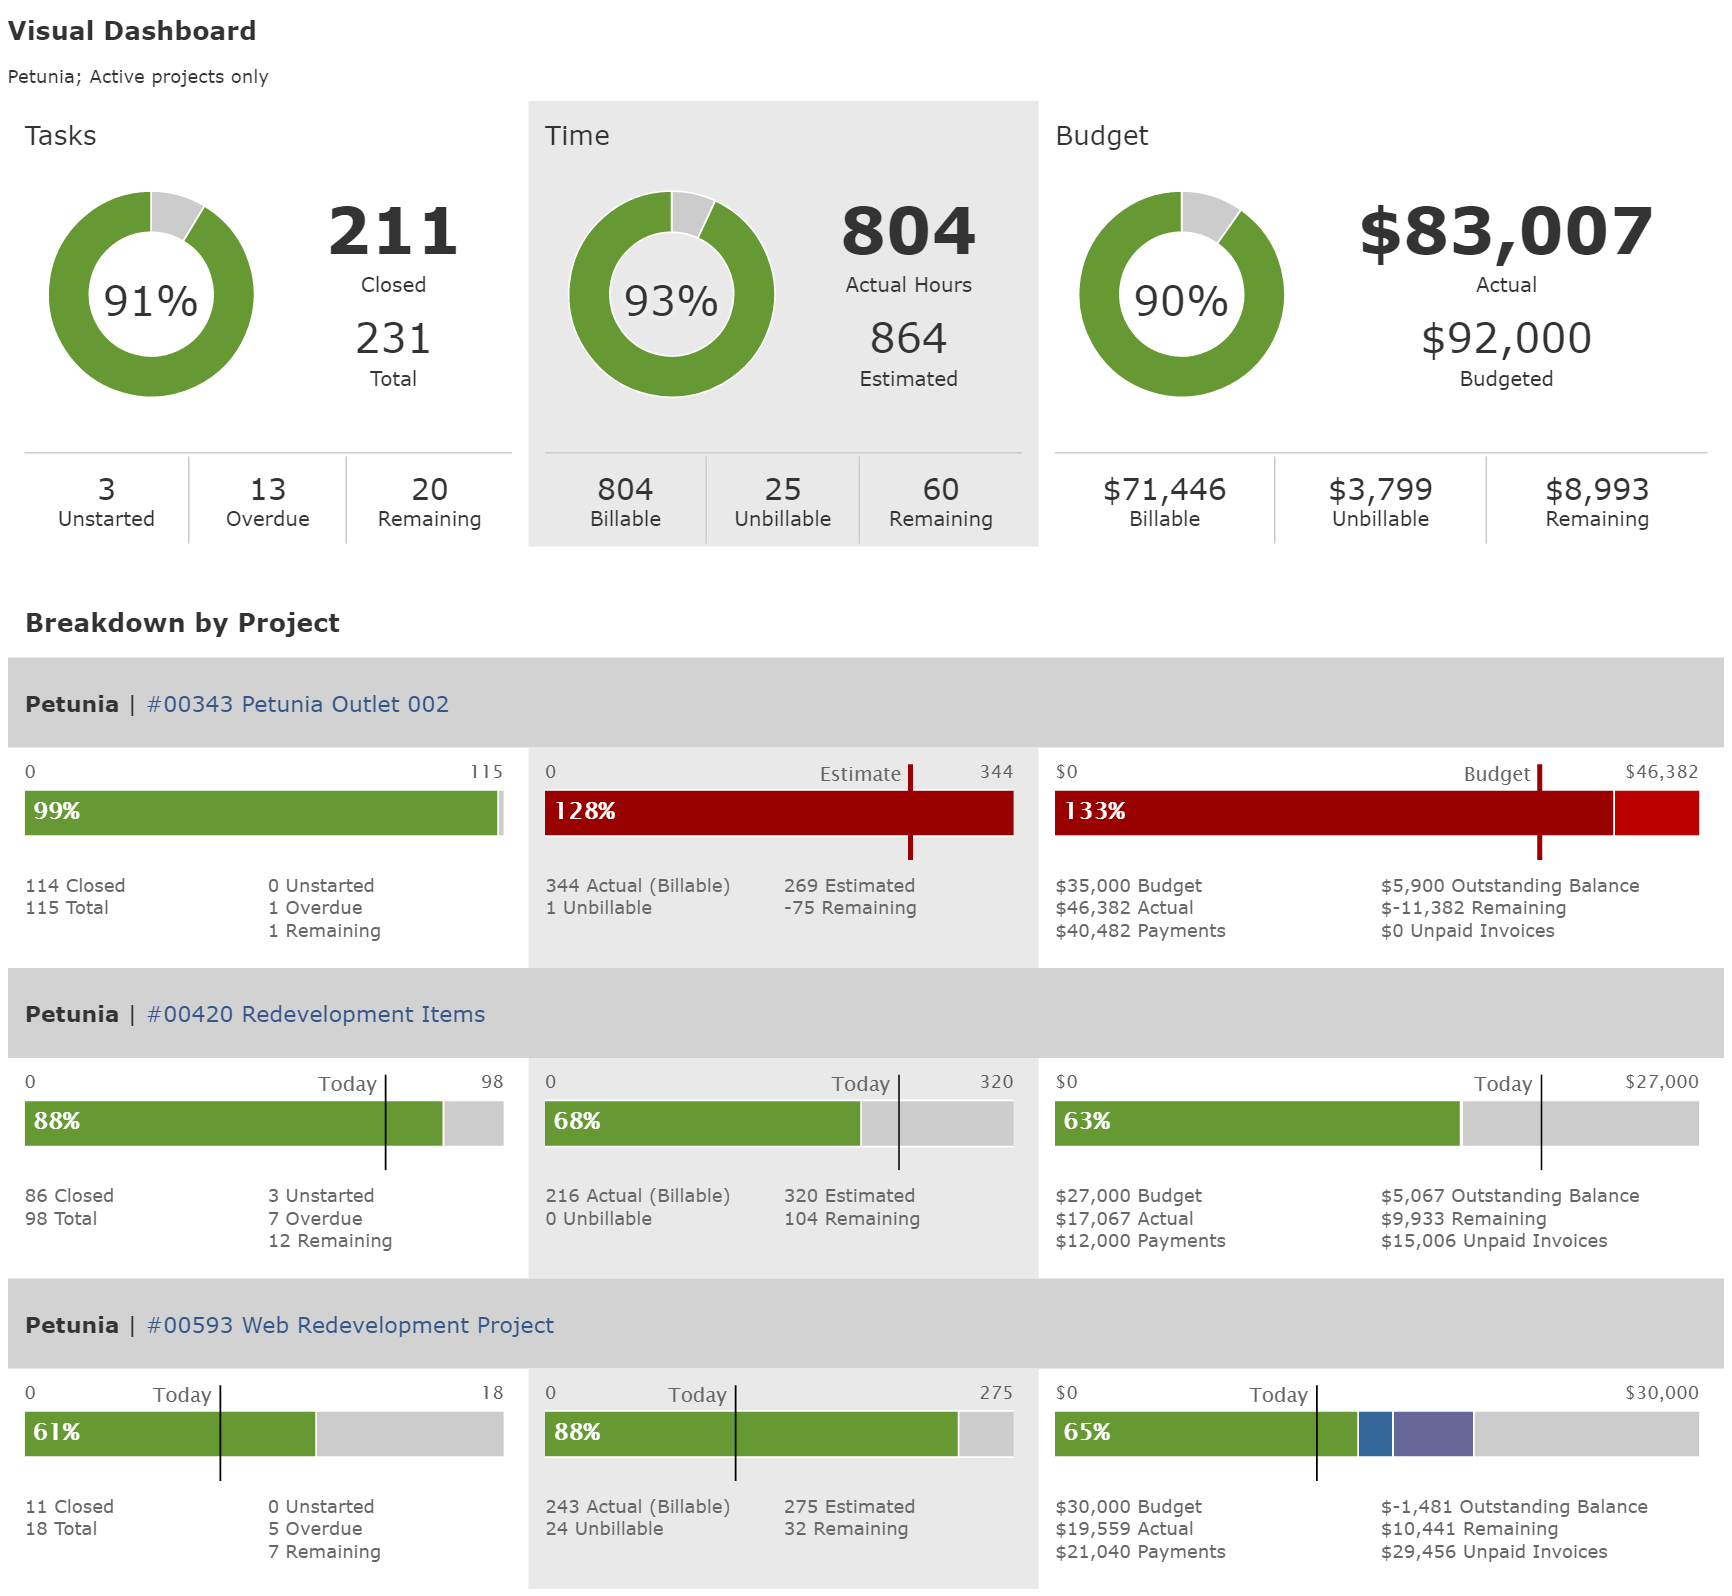
The upper portion of the visual dashboard consolidates all of the project data returned by the filters and distills the data into three sections — tasks, time, and budget. The pie charts show the percentage of work completed in each section. There are a few additional stats that provide a few more details. For example, the number of overdue tasks, and the number and value of unbillable hours.
Filter the dashboard by client to see the overall health of their current projects. Or, run it by project manager to see how well they are managing their current project load. Either one will result in a beautifully rendered visual dashboard that will quickly tell you how those projects are doing collectively.
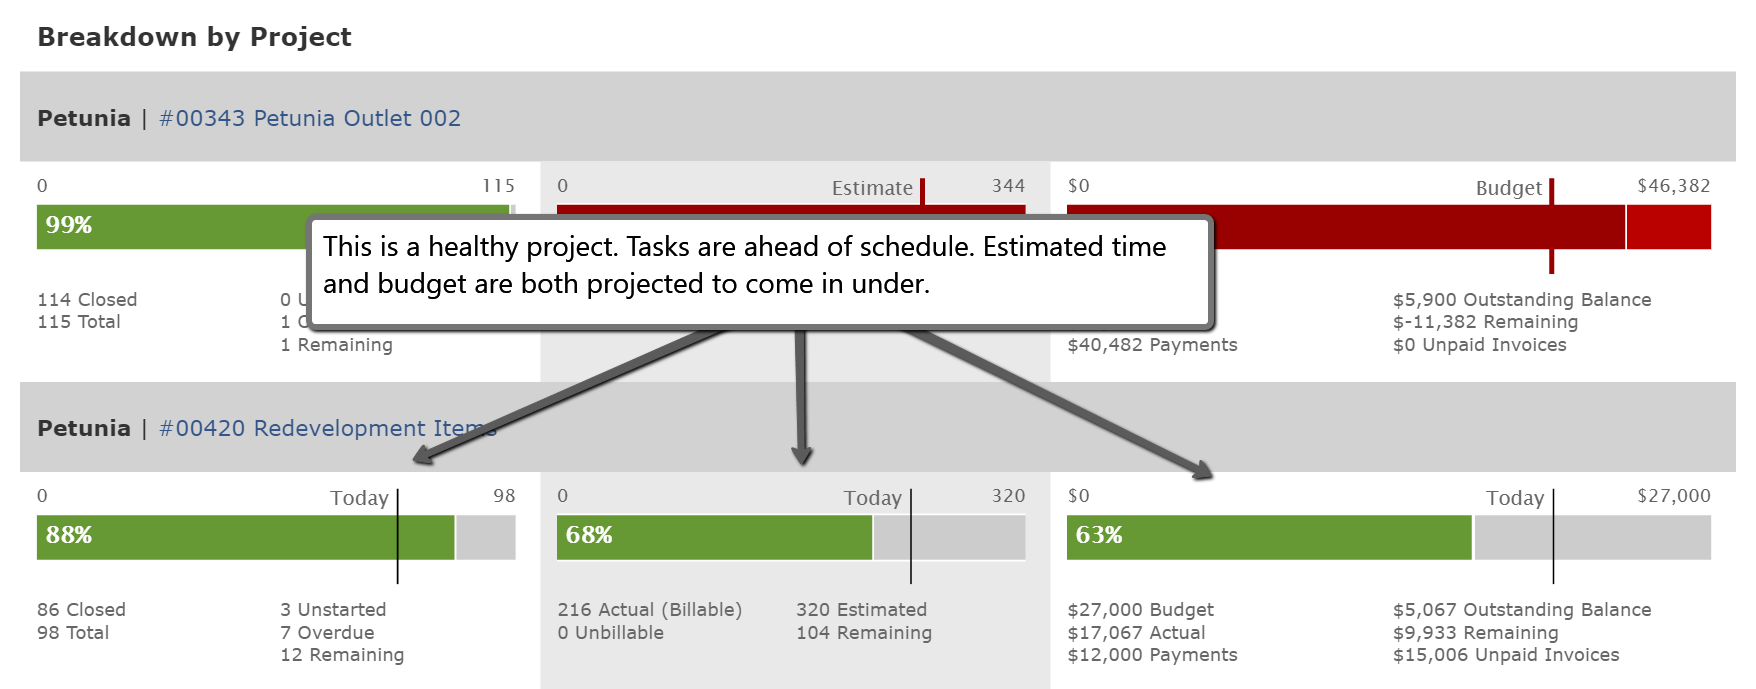
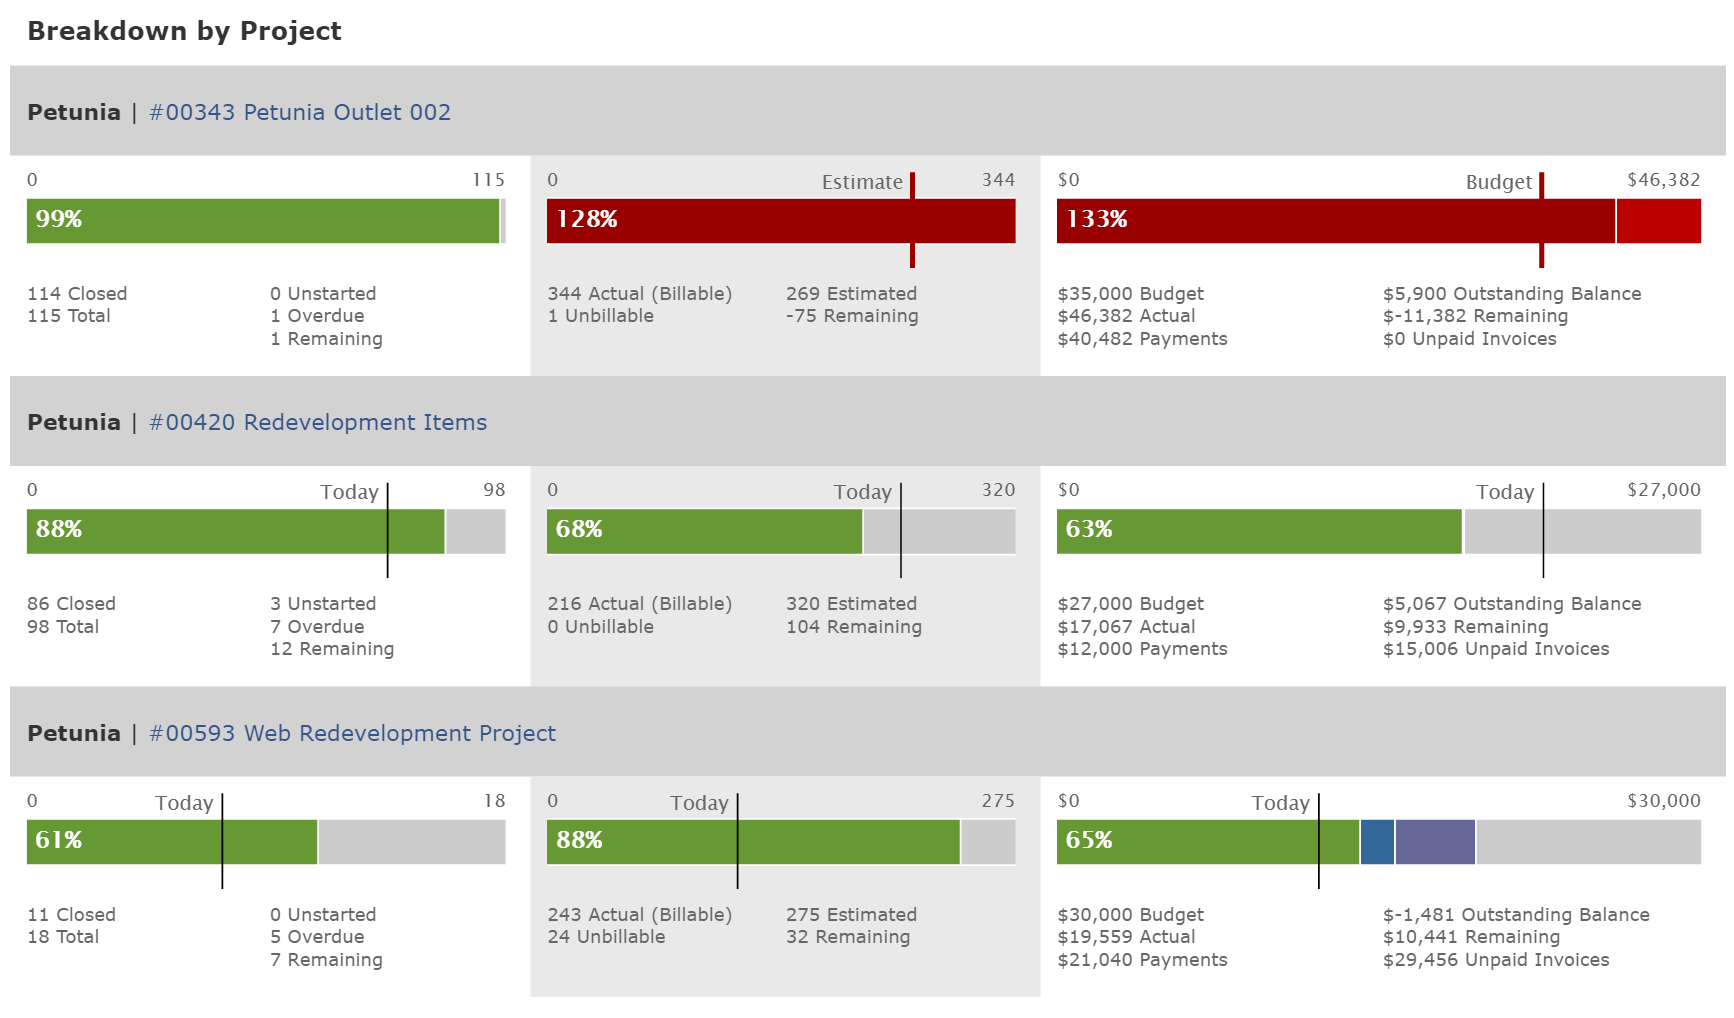
For more detailed information, scroll down to the lower portion of the visual project dashboard. Here you will find the percentage of tasks, time, and budget consumed by each project. And more details, such as which projects have overdue tasks and unbillable time. This section enables you to quickly deduce which projects are doing well, and which are not.
If the project is current, a vertical black line will be positioned relative to today. For example, if you are ten days in on a 20 day project, the vertical black line will appear at the halfway point. This indicator is designed to help with project pacing by visually alerting you to projects that might be trending toward going over budget or past their deadline.
What should we be working on next?
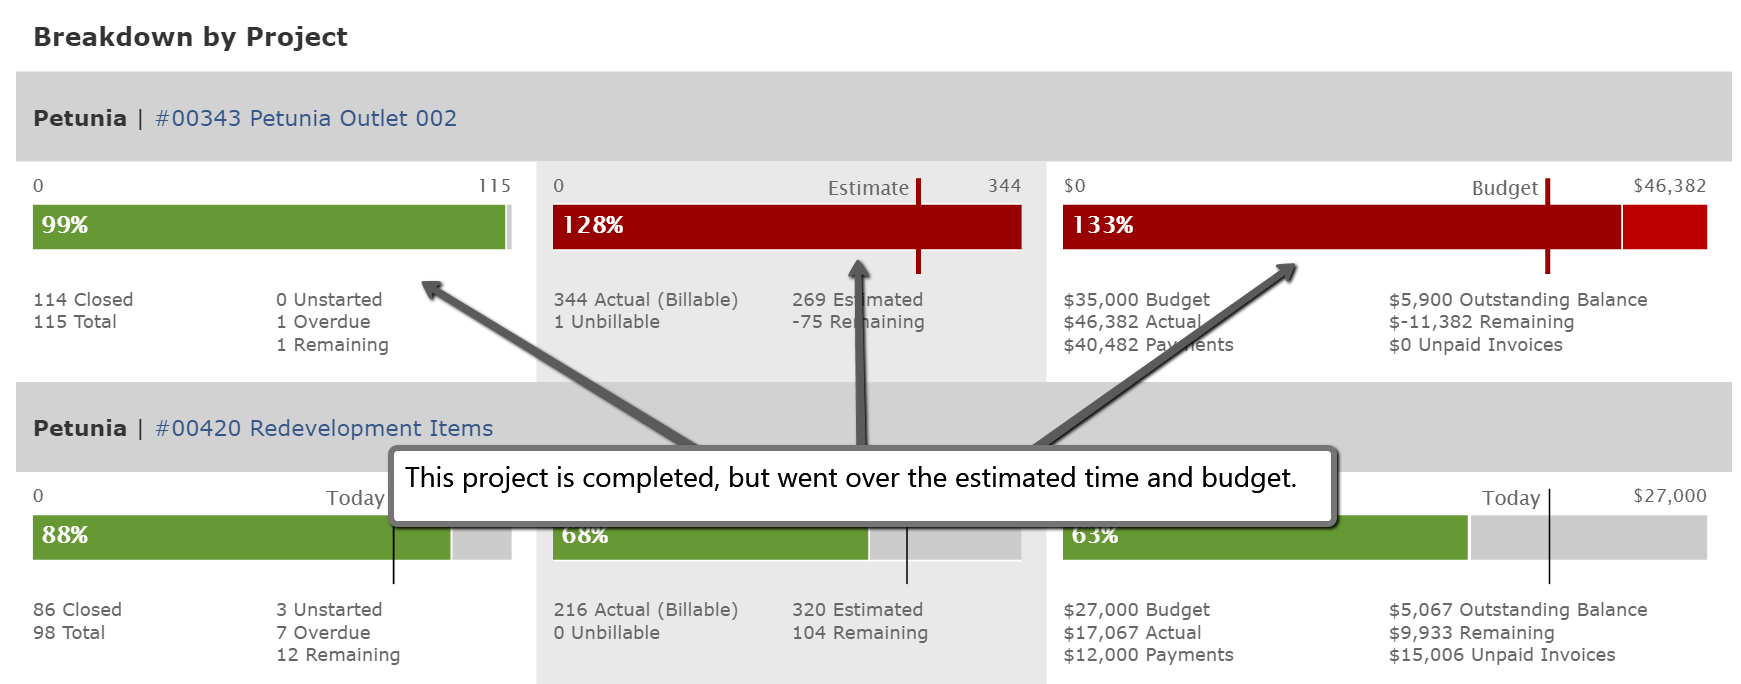
The lower portion of the dashboard breaks down the numbers for each project to help steer you in the right direction when trying to figure out what to work on next. For example, if a project has a lot of overdue tasks, it obviously requires immediate attention. Click on the number below the project graph and Intervals will pull up the listing of overdue tasks. Need to know which tasks haven’t started? Click that number to retrieve the list of unstarted tasks.
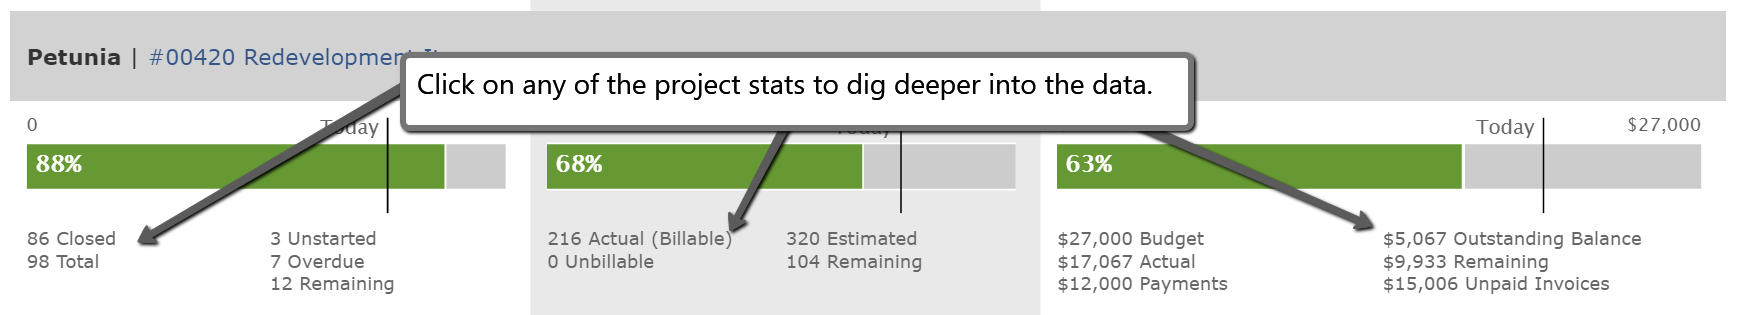
The stats that appear under the time and budget graphs are also helpful in steering a project in the right direction. If a project has only a few hours of estimated time left, click that stat to pull up a detailed report of estimated and actual time for the project to decide where to focus your remaining time.
What do you think?
Now that we’ve launched the visual project dashboard we’ll be iterating on it next. We want to hear your feedback. Does it effectively communicate project health? And does it help project managers focus their team’s efforts more precisely? Let us know what you think.
Awesome! Thank you so much
Hmm… i’ve been a long time user of Intervals and maybe use it differently than would a larger business. For this to be more helpful for me, I would like to be able to filter by dates and milestones also. Other than that, it’s a cool update!
This is a very simple and sharp presentation that really give a fast insight in the situation. I looked back on some closed projects and could quickly spot problems in the project planning. Excellent! It will be a big help when reporting to management / project sponsors.
Very nice–but what would be significantly more useful to me are:
i) Client-customizable invoices; every client has a unique format which must be followed or the world will end.
ii) A desktop widget for logging into and out of projects. yes, one can keep an internet window minimized and pop it open–but it’s not as convenient as the widget would be.
iii) Ability to log time on projects w/ a cell phone. logging time spent in the field is a real problem.
iv) Integration w/ quickBooks. consulting book keeping is complex: finder fees, bonuses, various compensation formulas based on participation by different levels of staff, expenses, etc. Project hours have got to be uploaded to something that has a chance of coping with all this.
v) Our team is a group of very independent people. Herding these cats into a timekeeping system has been a non-trivial task. In addition to the items above, Intervals pricing has been a sticking point. We do litigation consulting and the intricate time parsing capabilities of Intervals (by client, project, task, work type, etc) is not only unnecessary, but something our clients don’t want us to do. It’s a matter of not leaving footprints in the wilderness. Since we don’t use these capabilities, there’s resistance to paying for them.
vi) The number of open projects allowable under Intervals base price is a real constraint. Sometimes matters persist for years–in a few cases for more than a decade. When a project suddenly comes back to life, it’s inconvenient to have to reanimate it.
All that being said, I find Intervals to be fantastic. I’ve used several different time systems at various consulting firms including a Big 5 accounting firm. Intervals is the best.
Jack,
Thank you for the feedback. Most of these items are being considered but are not on the official development road-map at this time.
Regarding #3, we do have a mobile experience that works by using the native mobile browser on phones. Here is a help resource that explains the functionality https://help.myintervals.com/appearance-theme/intervals-mobile-version/. We have plans to overhaul the experience and add more functionality.
Regarding #4, currently we have integration with the desktop version of QuickBooks https://help.myintervals.com/third-party-integrations/quickbooks/ and we are working on integrating with the online version of QuickBooks. We hope to release the feature in the next month or two.
Thanks again – Michael
This is definitely a step in the right direction. As with any professional services timekeeping program, it is critical to associate time with effort in all work activities. It would be extremely helpful to have an Outlook integration that would allow a message, response, document, whatever that is being sent to a client regarding one of their projects to be logged to Intervals with the time. Barring that, it would just be nice to have the ability to ingest an email. Dragging and dropping documents is a dream. But I spend 90% of my day in Outlook and would like to even drag an email message in to the program if a MAPI interface is not realistic.
Also, calendar tasks are listed by date created. I’d love to have a toggle view to see date due. Right now my calendar looks like a rainbow threw up on it and I have to click in to every task to see OH, that one is not due for two weeks or oh shoot, I missed that on Friday.
Chris,
Thank you for the feedback. The Outlook integration ideas sound interesting. I can see how it would be helpful to upload emails into Intervals. We’ll certainly take the idea under consideration.
For the calendar tasks, get in touch with our support team. We may have some ideas on how to filter the calendar view to tone down the rainbow.