One of Intervals’ core strengths has always been reporting. Intervals has an abundance of visual graphs and charts sprinkled throughout the software. For example, the project dashboard can be referenced to see how a project is progressing. And there are several reports for visualizing time tracking data. More recently, however, customers have been asking for something more high level, something commonly referred to as a “visual dashboard.” So we have set about building one.
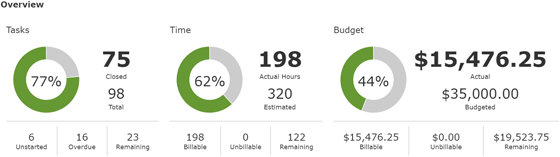
The design and development process is progressing as planned. Above is what we’ve completed of the tasks, time, and budget overview thus far. The larger numbers at the top illustrate how much of the project has been completed. While the smaller numbers at the bottom provide more details. We still have more work to do, but were excited.
The Backstory
We started by interviewing our customers to get a better idea of what exactly they need. It soon became clear that the purpose of a visual dashboard was to quickly answer two questions. First, how are my projects doing? And second, what should I be working on? Once we had a vision, we took it to the drawing board.
We collected examples of visual dashboards that demonstrate solid design and an intuitive presentation of the data. Then we started sketching out ideas of our own to find the best way to visually distill and present the data. The pencil sketches below show how the process evolved.
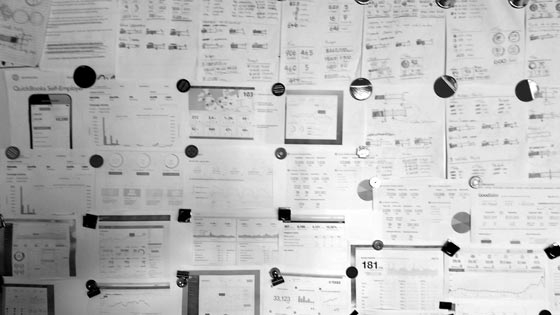
Early brainstorming sessions where we printed out several examples of good dashboard design.
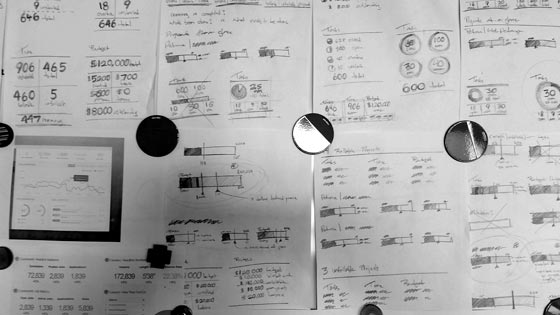
Sketching out ideas, iterating with pencil and paper to explore different ideas quickly.
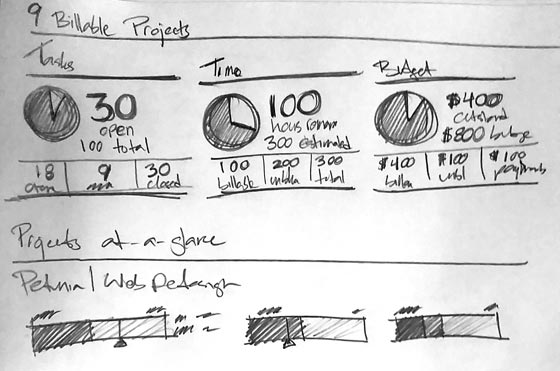
Narrowing down the sketches to what works best. It’s not just about how it looks, but what it’s communicating. This final sketch was our best answer to our customer’s conundrum, so we took to the computer and started developing it.
Let us know what you think.


Hi,
for what I need it would be helpful to have the possibility to drag and drop items into the report head I want to create. Items I commonly use are:
Head of the report
-Project Name
-Project Budget
-Estimated vs. Actual hours (only the totals)
-Progress percentage
Content of the report
-List of unclosed tasks grouped by Status
Thanks for your time!
-Marco
@Marco,
Thank you for the feedback. We really appreciate it. These are some great ideas. We’ll take note of them while we finish building out this feature.