As a Web development agency we do our best to ensure applications will perform under a variety of customer conditions. But, we can never account for every scenario before launching our app out into the wild. There is a good chance the application will encounter slowness at some point. It could be a week after launch, or a year. When the app does begin to show signs of slowing, we want to be ready to troubleshoot and resolve the slowness.
In this post…
We’ll be taking a look at our Web-based task management and time tracking software, Intervals, which recently experienced some slow page loads with one of its features. There is a page in our app that allows our customers to edit project permissions, to determine which people can access certain projects. We began to notice this page was slowing down for customers with a lot of projects.
Our first suspect was the database, so we made some changes there to speed up the queries. However, it wasn’t enough and the page still responded slowly. So we decided to take a closer look at the code. To troubleshoot the bottleneck we used Xdebug and Cachegrind.
Xdebug
Xdebug is a PHP extension used to profile your code and generate a stack trace. The first thing we did was profile the page using Xdebug to establish a baseline and analyze the output. Please see this article for more information on installing and running Xdebug.
Cachegrind
The cachegrind file needs to be visualized using an external tool. The most popular ones are WinCacheGrind and KCacheGrind. Once the cachegrind file has been generated by Xdebug, open it using one of these cachegrind programs.
Troubleshooting the bottleneck
The first thing we did was open the cachegrind file and sort on the Total Cumulative Time column. Then we started looking for function calls that were either redundant, slow, or both. We noted that the page took 13.2 seconds to load, an unacceptably high load time for this particular page.
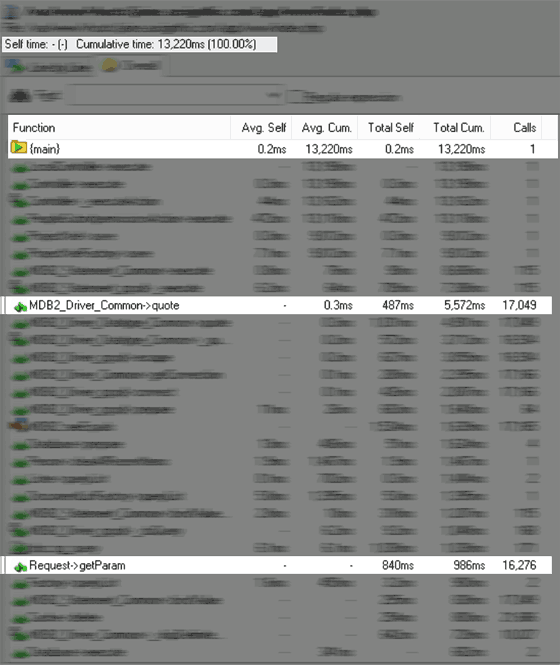
The first thing we noticed was a high volume of calls to Request->getParam(). This is a function that reads and sanitizes a variable from the submitted POST query. Because it was inside a loop, our code called this function over 16,000 times for just one variable. We only needed to sanitize the variable the first time, so we changed the code to call Request->getParam() once and assign the returned value to another variable. The loop then used the newly assigned variable instead, reducing the number of calls to one.
The second thing we noticed was a high volume of calls to Db->quote(). This function is used by our database abstraction layer to properly escape values going into the database. The explanation for the high volume was the same as above, it was inside a loop. The amount of time spent on escaping database inputs was almost half the scripts entire run time. We knew that all of the values going into the database were integers, so, instead of running the values through layers of abstracted code, we simply cast each value as an integer. This effectively escaped the value and reduced the number of calls from over 17,000 to zero.
Having identified two major bottlenecks, we decided to run another profile to see how much the page had improved.
The results

As you can see from the second cachegrind file, the optimizations made a huge difference. The overall execution time went from 13.2 seconds down to 2.5 seconds. A huge win that required only a few lines of code to be changed.