The prevalence of code frameworks has benefited web developers greatly. Web developers can focus in on the application layer of the software stack and churn out web sites with unprecedented quality and speed. Meanwhile, the database layer and operating system are largely unaffected by the application.
In this post…
That is, until something goes wrong. In my 20 years as a web developer specialist, performance issues have typically been the result of application inefficiencies introduced by myself and other developers. The application is hogging too much RAM, or running a poorly written database query, and chaos ensues. When the web application falters, these five useful Linux commands for developers are indispensable in troubleshooting the underlying issue.
htop
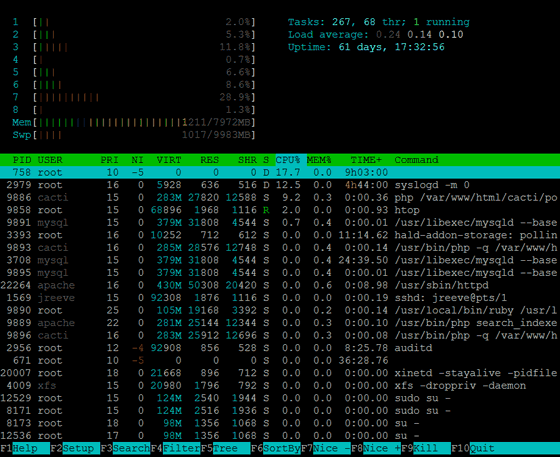
I always go to Htop first when a server is exhibiting problems. Htop provides a colorized view of CPU, RAM, swap, and load — and a list of all running processes. Htop can search, filter, and sort processes, and terminate or kill any one of them. The high level view makes it easy to see if server load is too high, or if RAM is getting chewed up. And, I can sort the list of processes by CPU or RAM to see which ones are causing problems.
Common commands:
htop -s PERCENT_CPU
Run htop sorted on the CPU column. Other options are PERCENT_MEM, PID, STARTTIME, and USER. You can also sort inside htop by clicking the mouse cursor on any of the headings.
htop -u apache
Show only the processes running under the apache user. Useful for singling out web-related processes.
Documentation:
http://linux.die.net/man/1/htop
iostat
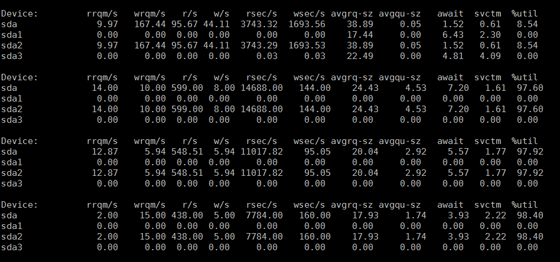
The iostat command reports on the amount of data being read and written on the drive, and can also report on disk wait times and percentage of disk utilization. Too much i/o activity can pin down a hard drive and slow down the application. If an application is using poorly written queries, it can result in the database doing too many reads from the disk and drastically slowing down the server’s response time.
Common commands:
iostat -xd 1
Report on disk i/o every one second and include extended metrics. Use this command to view percentage of disk utilization (%util) and average time (await).
Documentation:
http://linux.die.net/man/1/iostat
ps
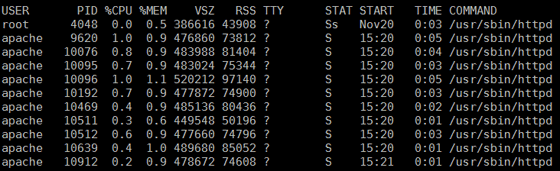
The ps command is another way to look at currently running processes. It shows the same information as htop, but is a snapshot rather than a continual stream of data. Just like htop, it will show the process name, amount of RAM, percentage of CPU utilization, and amount of time it’s been running. This command is most useful for filtering a subset of processes for more focused and detailed analysis.
Common commands:
ps aux
Show user, PID, CPU, MEM, and other stats about all currently running processes. Piping the results through grep is the fastest way to filter the processes.
ps aux | grep -c httpd
Count the number of httpd processes running. This command is useful to see how hard apache is working and if its close to maxing out.
Documentation:
http://linux.die.net/man/1/ps
vim
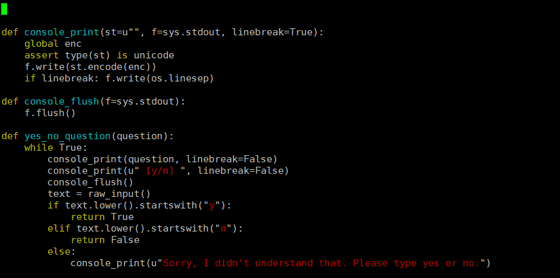
No matter how awesome your code editor might be, chances are it won’t run from the Linux command line. The vim text editor does, and it’s installed by default on every Linux distribution on the planet. Knowing how to use basic commands inside this text editor is critical when having to troubleshoot on live production servers. Whether it’s your code or a server config file, vim is the best way to quickly update files on Linux.
Documentation:
http://www.vim.org/docs.php
cURL
The cURL library is used for making HTTP requests and analyzing the response from the server. When a web server responds to HTTP requests it includes additional information useful for troubleshooting. Unless you are using developer tools inside the web browser, this information is hidden. cURL can be used for analyzing headers, cookies, SSL, and response times.
Common commands:
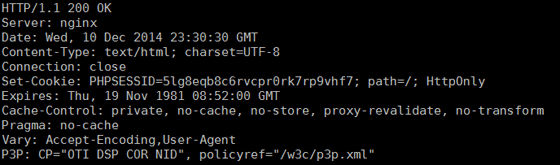
curl -I www.myintervals.com
Query a web page and display only the headers from the response. This command is most useful for analyzing HTTP status codes, content types, and caching.
curl -3 https://www.myintervals.com
Use SSLv3 protocol to establish the SSL connection. In light of the recent POODLE vulnerability, this command is most useful for making sure web servers aren’t accepting SSLv3 connections.
Documentation:
http://curl.haxx.se/docs/manpage.html