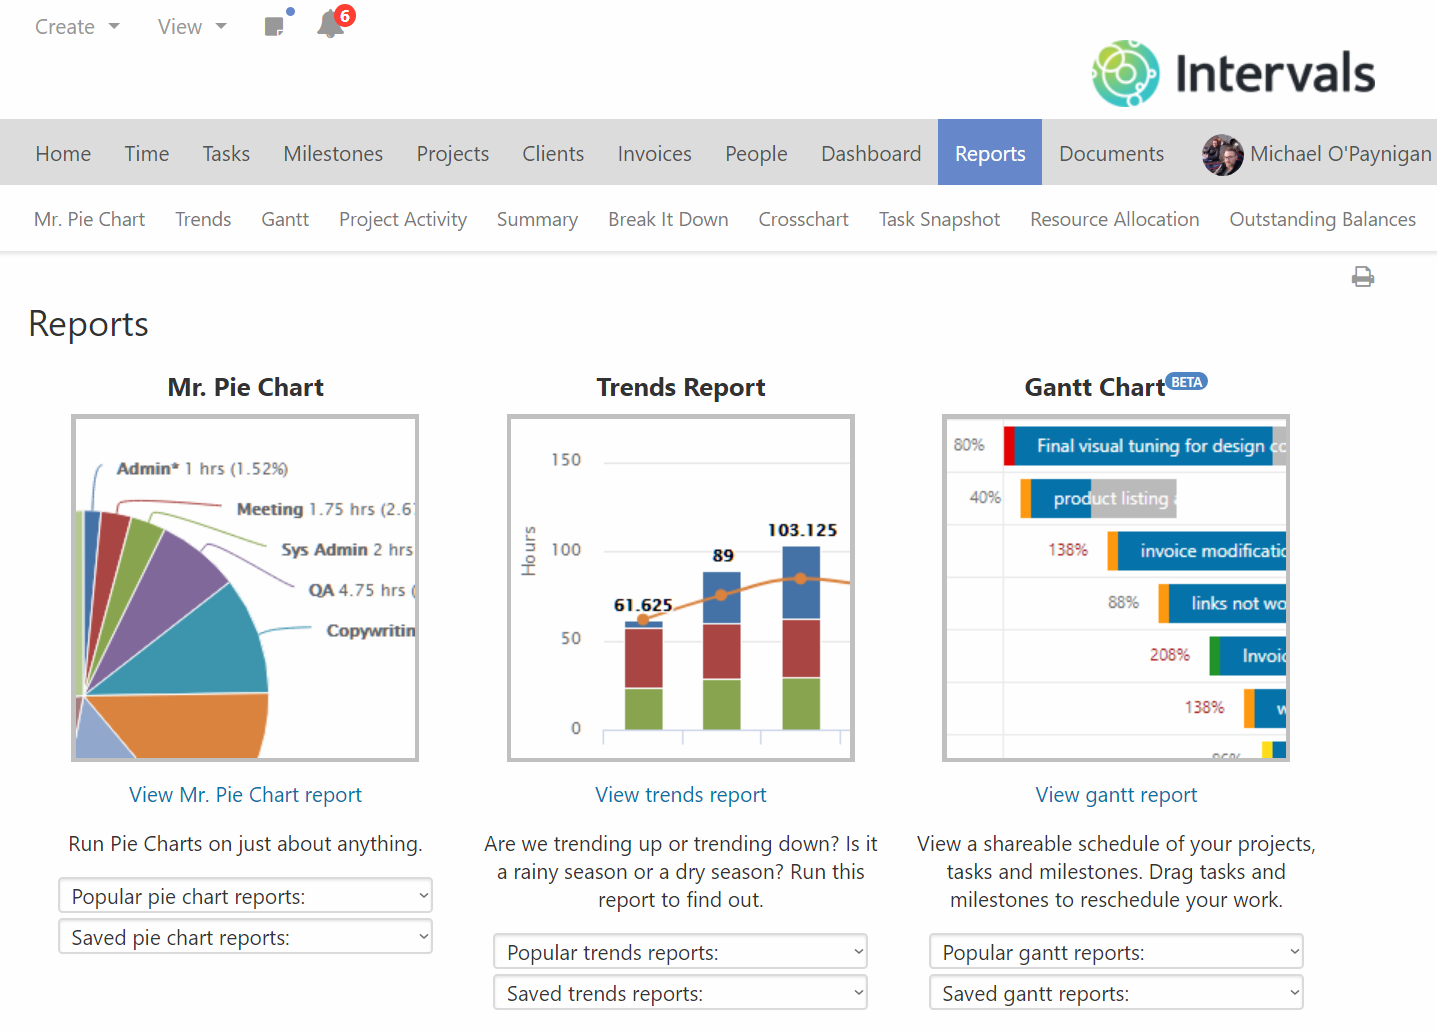
One of the most requested features we have received is to add a Gantt chart. Being able to take your time and task data and make meaningful decisions about your projects is a primary goal for Intervals. We have heard time and time again from our customers that one of the features that really sets Intervals apart is the reporting and we are happy to announce that a Gantt chart has been added.
The Gantt chart can be found in the reports section of your Intervals account.
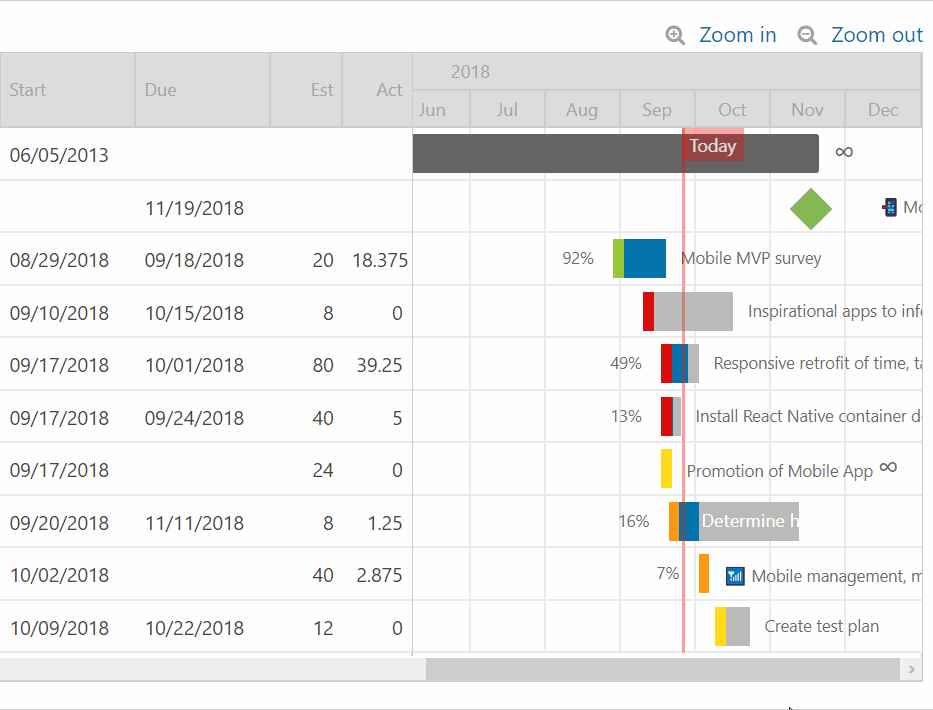
The Gantt chart can be used to not only visualize your tasks, milestones, and projects but to interact with your data. You can drag tasks and milestones to reschedule them and tasks can be dragged to change their duration. The Gantt chart is a great way to examine a project and see how it is coming along and make any changes needed to hit the project deadline.
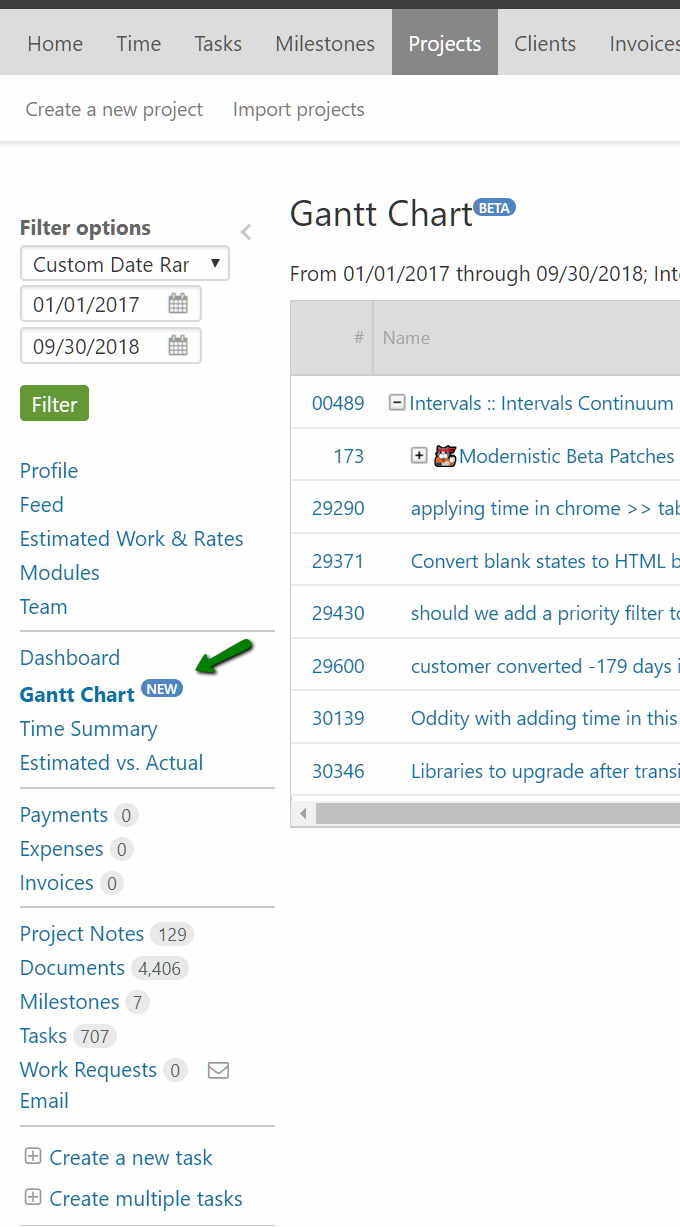
The functionality is also available when viewing an individual project. Similar to the Dashboard, Time Summary, and Estimated vs. Actual, you can interact with your tasks for a particular project via a Gantt chart view, without having to navigate to Reports and apply filters.
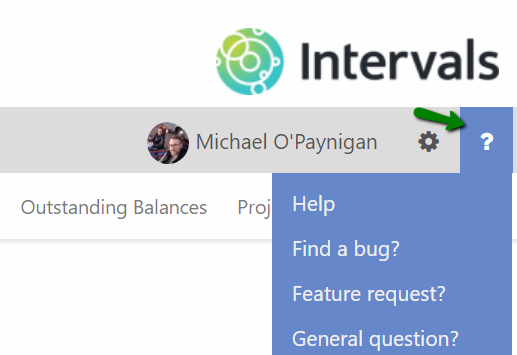
Please give it a look and use the feature request and find a bug links from within your account to give us any feedback.