Please head to help.myintervals.com for help articles and guides. If you have any questions, please contact our support team.
-
- Michael
- Feb 1st 2007 edited @ 09/25/2018 12:22 pm
Recently we were asked if Gantt charts are going to be added to Intervals. We currently do not have any plans to add Gantt charts.
Our rationale is that a lot of people glaze over when looking at Gantt charts. Project managers and people who know how to create and read Gantt charts love them, but no one else on the team does. I have personally been in many a meeting where Gantt charts were used to make everyone feel good that there was a schedule but few actually understood the project plan and potential risks in the schedule. Most of our customers just don't appreciate what a Critical Path is.
Intervals does not have a lot of scheduling built into it. We did this on purpose because there are so many different ways to build a project schedule...especially with small companies. We found some people use Microsoft Project and other desktop Project Management software, but many use Microsoft Excel, whiteboards, and individual systems to create project schedules. Intervals is flexible and lets you schedule your projects in your own fashion.
This doesn't mean that you can't use Gantt charts in your process. I personally use Microsoft Project to plan out the project relationships and timelines that I manage, but I use Intervals to get the actual work done and track the effort on tasks. Intervals flourishes at managing tasks, tracking time, and managing budgets while giving you detailed analysis of your efforts.
We do have plans to layer in some basic scheduling. It will be more in the form of "Project Calendars" and/or "Resource Calendars" but not full tilt Gantt charts at this time. -
- mlandis
- Aug 6th 2007
Hello,
I think the idea of project calendars or resource calendars is a good idea.
We are currently using Outlooking along with intervals but it is unessesary typing.
Thanks,
Matt -
- Michael
- Sep 4th 2009
Since this post has lived for quite some time I thought a quick update might be good. The milestones / calendar piece launched awhile back and it allows you to create milestones, attach tasks to them, and move an entire project around fairly easily (4:00 Minute Milestones Video Introduction). We use milestones for each "sprint" for lack of a better term and if the current sprint needs to move back we move the milestone and all of the subsequent milestones and tasks move as well. We usually have about four sprints planned out (one quarter) and the milestones piece has added a lot of value for us to group, manage and move tasks in bulk.
On the Gantt chart front, our philosophy has not changed a ton and we do not have plans to add task dependencies (Finish to Finish, Finish to Start, Lag, Lead, etc.) because we believe it adds too much complexity in the interface and the feedback we receive overwhelming supports the current flexible task system. We do plan to address creating a visual way to view all projects and tasks to see where things are scheduled and how far things are along. The visual format is very much like a Gantt chart but in my mind if tasks don't have dependencies and there is no critical path it is not a Gantt chart but I guess that is a matter of debate over definitions. The periscope report is currently scheduled for Q4 this year. -
- bbruck
- Sep 9th 2009
Thank you for that update, Michael.
In service of seeing "how far things are along" are their any plans to incorporate a "percent complete" feature for tasks (v. amount of time applied v. originally estimated)? We have adapted to the lack of dependencies, but it's still very difficult to use Intervals for managing our work without being able to see how much of a project has yet to be done... -
- Michael
- Sep 10th 2009
We don't have plans to add the ability to mark a task at a percentage complete at this time but we will add it to the list of potential features to consider. Although there is not a way to mark the percentage complete on a task there are a variety of ways at getting at the project estimated versus actual hours.
- You can view the estimated and actual hours within each project by clicking on the estimated vs. actual link in the left hand navigation within a single project. You can toggle the project estimates versus the task estimates to get an idea about how the tasks look versus the original estimated budget.
- Another item that might be worth a look is the project activity report since it includes task estimates and actuals if you select ‘by task†in the summary drop down menu.
- A somewhat hidden feature is exporting the project listing. If you got to the project listing and click on the export to spreadsheet icon the export includes additional columns of information (Estimated Work, Task Estimates, Actual Billable Hours, Actual Unbillable Hours, and Actual Hour Totals). It can be used to get a pretty good sense for where each project is at.
- The task listing includes estimated and actual hours and the listing can be filtered for individual projects, modules, resources, etc.. We use this functionality quite a bit in conjunction with milestones since we use milestones for deliverables. I can filter for the individual milestone and see the estimated and actual hours for each team member to see how loaded up they are.
None of those include the exact functionality but I thought I would mention it just in case it adds value. -
- marc-andre lacas
- Jan 15th 2010 edited @ 01/15/2010 7:37 am
Suggestion:
Create a way to parse the informations from the Intervals database to a format (xml?) that can be read by the free GanttProject application. The GanttProject application would then become a "Gantt viewer".
Use the filters in Intervals to select which information will end up in the gantt chart, then save as PDF and include the PDF of the generated gantt chart in the project Documents vault...
https://www.ganttproject.biz/ -
- jreeve
- Jan 15th 2010
Intervals data can be exported via the data export under Options -> Settings & Defaults -> Data Export tab. The data can be exported to XML from here. Another option is to export the data to XML using the API. -
- Michael
- Oct 14th 2010 edited @ 10/14/2010 5:25 pm
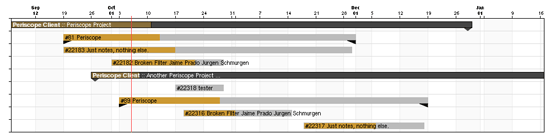
The Periscope report has been modified to include milestones and tasks as bar graphs. The representation is very similar to a Gantt chart and you can run filters for individual owners, assignees, etc. More information is available here in the blog. We don't consider it a true Gantt chart since there are no task dependencies or critical paths but if you need a visual representation of every task and milestone for a project and how far along each item is it should add a lot of value.
-
- caryweston
- Jan 13th 2011
Michael,
is it the philosophy of Intervals such that there is no way of creating dependent tasks - a task that can be created without a physical start date but rather begins at the conclusion of another task? -
- caryweston
- Jan 13th 2011
Michael,
also - to the relationship of tasks/modules..two questions:
1. is there a way to pre-assign tasks to modules so that when a module is added to a project, the tasks come with it?
2. is there a project or dashboard view that would allow me to see modules and assigned tasks for the project on same screen? Perhaps an expand module detail to review tasks per module?
Thanks
Cary Weston -
- Michael
- Jan 14th 2011
The closest functionality to #1 is copying a project but that will copy all tasks, modules, milestones, etc. so it is a little bit different. Regarding #2 if you click on "show widescreen view" on the top of the task listing additional columns of information appear including client, module, milestone, and start date. If you click on module the tasks will group by module. Also, the home page can be used in a very similar fashion if you would like to see tasks by module in a calendar view. -
- Michael
- Sep 25th 2018 edited @ 09/25/2018 12:25 pm
## Update ##
Based on feature request and a some customer interviews Intervals includes a Gantt chart now. More information about the Gantt chart functionality is available here on the official help site.
1 to 12 of 12
Comments are closed.
For more Intervals help documentation, please visit help.myintervals.com